If you’re looking to quickly access the sheet click here, or here is a breakdown of what will be covered today:
- An introduction to Core Web Vitals and what this Google Sheet aims to do
- How to set up a Google API key (if you don’t have one already)
- The basic set up of the Google Sheet
- How to track metrics of individual pages using the sheet
- How to compare Core Web Vitals for aggregate domain data using the sheet
- How to set up email alerts with the sheet
- Troubleshooting
There is great anticipation ahead of the Core Web Vitals Google update, which has been pre-announced for May 2021.
Nobody quite knows the impact it is going to have. It is rare for Google to pre-announce any sort of major change to their algorithm though, so naturally the industry has sat up and taken notice.
From a personal point of view, I don’t think it’s going to be the overnight switch that some marketing agencies might be suggesting. Google have more or less said that it’s not going to result in a monumental shake-up to the SERPs.
Furthermore, if we look back to the Mobilegeddon Update in 2015 which was also pre-announced, the initial changes were barely noticeable. Of course, as time has progressed, it would be fair to say that the dial has ramped up considerably. One might suggest that the same will happen with Core Web Vitals.
Regardless of what you think might happen in the short-term, it would appear sensible to keep tracking (and improving) your own Core Web Vitals.
I have created a free Google Sheet that does this work for you. It will record PageSpeed Insights data for every page that you specify, on a daily basis. It will record both field and lab data from Google, as well as sending email alerts if certain rules which you have set have been triggered.
While the field data (i,e. real-world data) is what Google are seemingly going to analyse as part of this page experience update, the lab data should not be dismissed. Firstly, some websites don’t receive sufficient traffic to qualify for field data. Secondly, field data can take time to update. As such, if your development team release a change, you are unlikely to see any impact to your field data for some time. Instead, you can look at the impact from a lab data perspective, to see if it has made any sort of difference.
First step: Get a Google API key for PageSpeed Insights (if you don’t already have one)
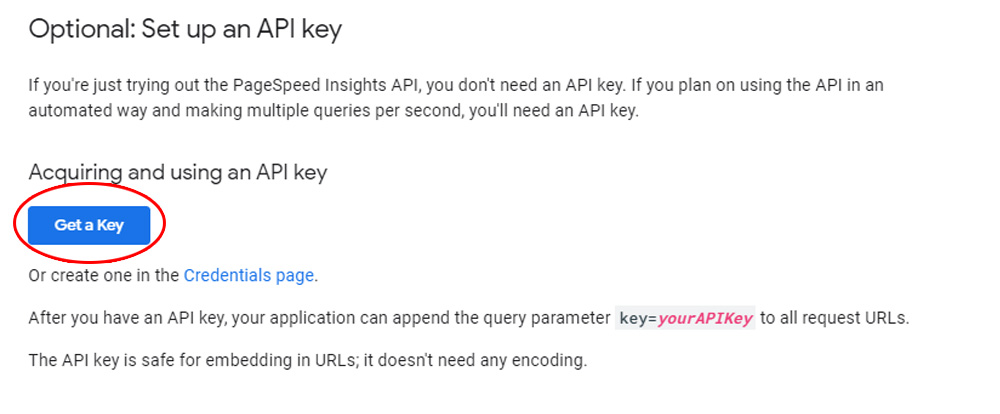
To use this script, you’ll need a Google API key. This is far easier to obtain than other authentication methods that Google use, and the follow steps should take just a couple of minutes.
- Head over to this URL and click the blue ‘Get a key’ link (see screenshot below).
- You’ll then be asked to select which Google Cloud Platform project you want the key to be associated with, or if you want to create a new one. In case of the latter, simply enter a name (it can be anything). If this is the first time you have used Google Cloud Platform, there may also be a checkbox asking you to accept their terms and conditions etc. Click ‘Next’ once you have selected your project.
- The final screen will show you your key, which you can copy and keep safe for the Google Sheet you will be using.
Now, onto the basic setup of the sheet
- Open this Google Sheet. Make a copy of the sheet (File > Make Copy). Or, you can go straight to this URL to make a copy – the choice is yours.
- Make sure that the Locale of the sheet is set to the United Kingdom (File > Spreadsheet Settings). I explain more about why this is important in the Troubleshooting section at the bottom of the post.
- For now, you just need to enter your Google API key on the Settings tab (in cell B1). If you haven’t got one, go back a step to find out how.
- The basic setup is complete. Let’s move onto what you can track via the sheet.
How to track metrics of individual pages
The first thing you can track via the sheet are individual pages. These can be any pages on the internet (they don’t just have to belong to your site). This is the section you will be editing:
The sheet will track both field and lab metrics (if your site doesn’t get much traffic, there’s a chance that there won’t be any field metrics).
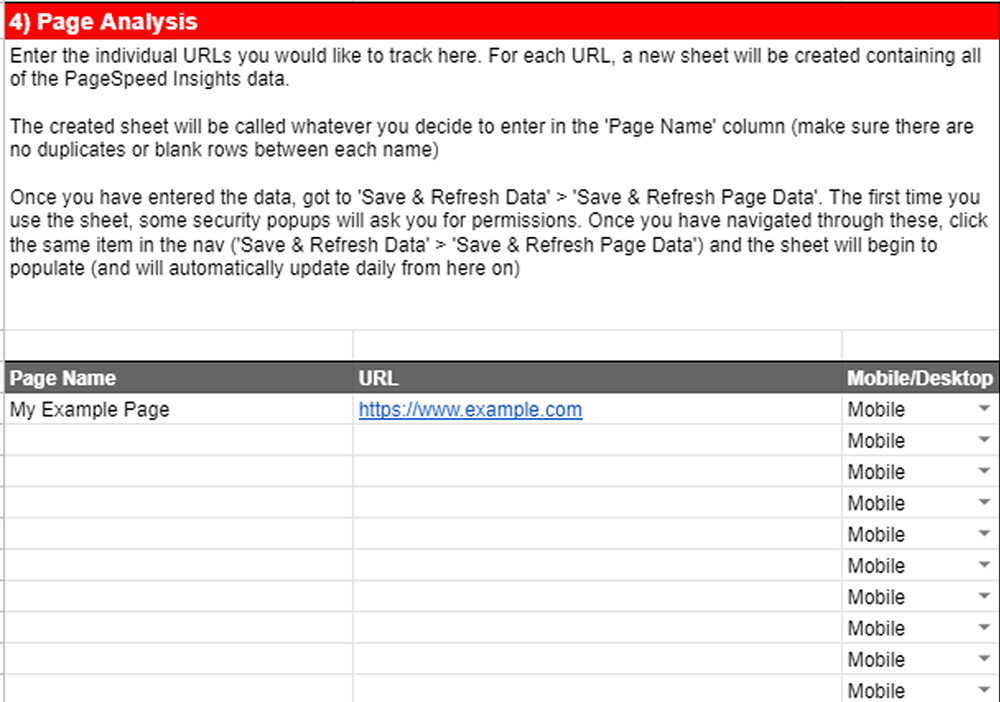
Start by navigating to the ‘Page Analysis’ section of the sheet. For each URL you want to track, provide the following information:
Page Name: This can be anything you want. The sheet will create a tab going by this name, which will contain all of the PageSpeed Insights metrics for the associated URL.
URL: The full URL you wish to track.
Mobile/Desktop: Choose which device you wish to track metrics across.
There are a few words of warning here:
- Make sure there are no duplicate page names.
- There should be no blank rows between each page you wish to track in the sheet.
- I would not recommend having more than ten separate URLs. Apps Script has a six-minute limit each time it runs. If you have an excessive number of URLs, this limit might be passed and the script will not conclude. I’ve come across some URLs that the API will take over 30s to run, so 10 URLs should be a safe limit.
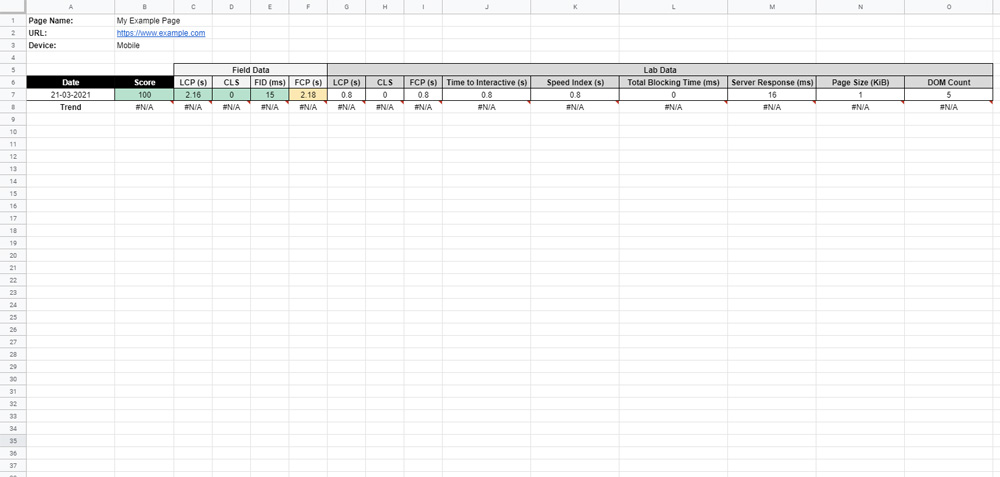
Once you have entered the data, go to Save & Refresh Data > Save & Refresh Page Data in the top nav. The first time you use the sheet, some security popups will ask you for various permissions. Once you have navigated through these, follow the same process again (Save & Refresh Data > Save & Refresh Page Data) and the sheets will begin to populate. The sheets should look something similar to the below (ignore the trend line for now, this requires at least two days worth of data before it starts to show a trending graph of each metric).
You can manually update the sheets at any time you choose using the above approach (via the top navigation). The script will purposely not update any sheets that already have data in for that day – but if you add any other pages etc, you can manually update and see the new data populate.
Now that you have set up the first part of the sheet, a trigger has been set to run this script every morning. As such, every morning you wake up, the sheet will now contain fresh data.
How to compare Core Web Vitals for aggregate domain data
An optional feature of the sheet is to compare domains against each other. This will use the aggregate origin data that Google stores. From experience, this is useful for basic competitor research. I.e, if you are asked how your site performs from a Core Web Vitals perspective against competitors, this aggregate domain comparison can show a quick answer.
This part of the sheet runs a bit differently to the previous one. All of the data is stored in the Origin Domain Comparison sheet. You can track up to six specified domains via this sheet.
To get started, enter the full domain you wish to track across row 5. The first one already has “https://www.example.com” – you can replace this and add others across the row in the same format.
Once you are happy with the domains you have selected, navigate to Save & Refresh Data > Save & Refresh Domain Comparison Data in the top menu. If this is the first time you have used the script, it will ask you to complete a few security prompts. If this is the case, you’ll then have to repeat the process (Save & Refresh Data > Save & Refresh Domain Comparison Data) and the table below will start to manually update.
The first time you use the script it will look something like this (again, ignore the Trend line – this will show a trend graph after accumulating two days’ worth of data):
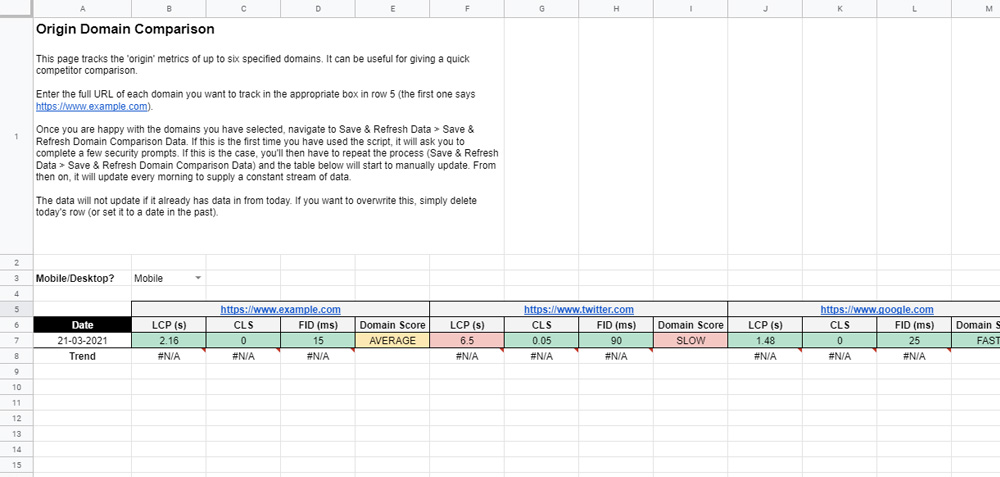
From then on, it will update every morning to supply a constant stream of data.
The data will not update if it already has data in from today. If you want to overwrite this, simply delete today’s row (or set it to a date in the past).
How to set up email alerts
Another feature of the Google sheet is to set up email alerts for all of the pages that you are tracking.
The alerts can be set up from the Settings sheet.
Firstly, in cell B2, tick if you want to receive alerts. If you do, enter the email address you wish to receive them at in B3.
You then need to configure the rules, in the following part of the sheet:
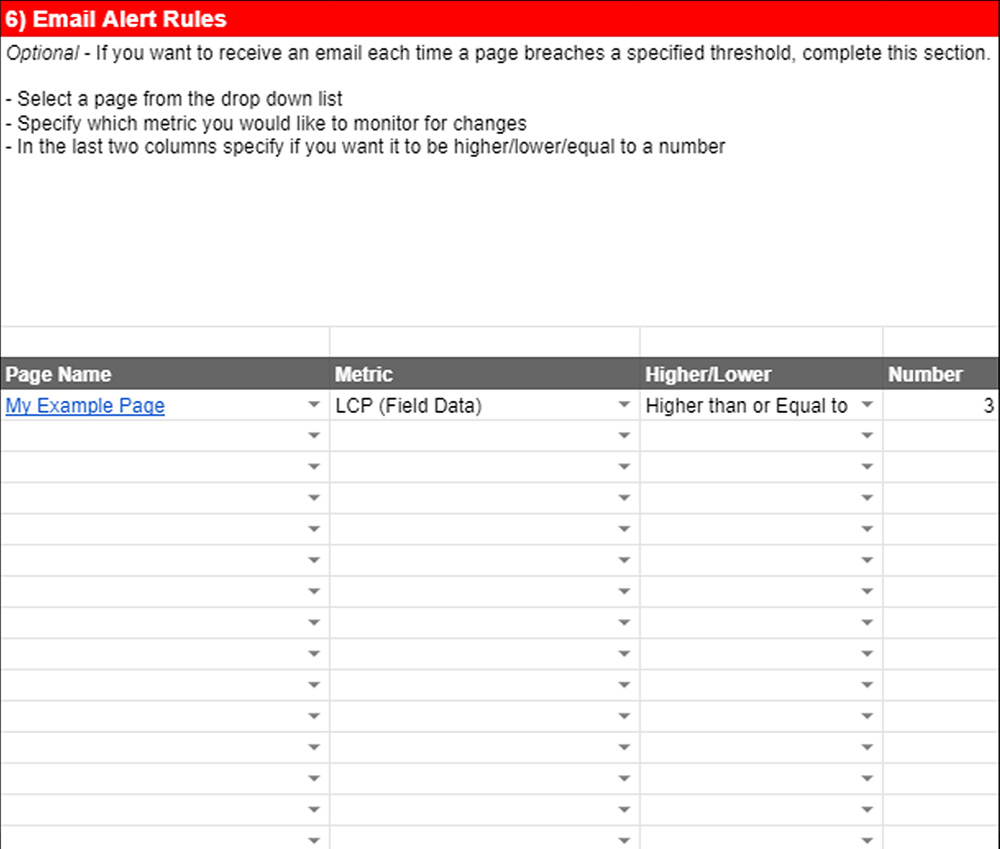
This should hopefully be quite self-explanatory. You need to enter the Page Name via the drop down list (this just pulls in all of the pages you have created in the Page Analysis section from the Settings sheet), the metric you wish to track, and how you wish to track it.
In the first rule, we’re saying that we want to receive an alert if our Example page’s LCP (using field data) is higher than or equal to 3.
These rules will be checked every morning. If they are true, you will receive an email alert to the address you specified.
Troubleshooting
I’ve yet to receive any common difficulties or questions regarding the sheet. However, if you have any, feel free to drop me a line or reach out to me on Twitter.
One issue I came across personally is trying to access the sheet with a Locale set to anything other than United Kingdom. The Google Sheet has been configured to automatically run by UK date formats (it’s set to UK in the settings). I have found that changing this setting can cause problems. As such, if you really want to change the date format, my advice is to do it manually by selecting the cell range and navigating to Format > Number and choosing the date format that works best for your needs.
I have not tested the sheet from multiple locations, but if you are finding that the formatting is skewed, check the settings to make sure that the Locale is set to United Kingdom.
If you have any other feedback my inbox is also always open. This is something that I have only put together over the last few weeks – but hopefully it will serve you well ahead (and beyond) the Core Web Vitals update.