For years I have looked on with envy on the various click-through-rate studies which have been conducted.
Some have suggested that a position #1 ranking will result in a CTR of 31%. Others have widened the net further, and broken the CTR down into several, impressive data categories, but still come back with surprisingly high results.
Unfortunately, I don’t think any can be relied upon. This isn’t due to their methodology, many (I’m looking at the Sistrix link in particular) are extremely comprehensive and couldn’t do any more in providing a more accurate view for the data they have available.
Instead, it’s about the umpteen variables that surround this topic.
For example, the obvious question is whether a term is ‘branded’ or not. If it is, it stands to reason that the CTR is going to be automatically higher. However, what if a company bids on their brand name in PPC? From experience, this can slash the CTR significantly (I’ve seen it drop from 70% to 20% in some cases). Already, you can start to see how data can become clouded very easily.
Or, what if a SERP was full of search features? What if it had standard Google Ads, shopping ads and perhaps a featured snippet as well? Again, so-called standard organic listings are going to appear lower down the page and ultimately, CTR will fall.
“You can start to learn the value of ranking in position ‘x’ for your key terms, which is great if you need to forecast SEO performance.”
It is very difficult for an industry-wide study to capture all of the above, plus, the many more variables that are unique to individual businesses.
Instead, the best data you can rely on is your own data. You know all of the variables, and you can make decisions off the back of them.
You can start to learn the value of ranking in position ‘x’ for your key terms, which is great if you need to forecast SEO performance.
Or, perhaps an even more actionable insight is knowing when a page is underperforming (or vice versa). If you can benchmark your site’s own CTR, you know when a particular page will require action.
This is why I have created a Google Sheet that tries to do as much of this analysis as reasonably possible.
It will analyse the last sixteen months of Google Search Console data for keywords of your choice, calculate the average CTR for every position you appear in, and output the results in a pivot table. You can also set it to automatically refresh the data every seven days, so your benchmarked CTRs are always updating.
I’ll never claim to be a software developer (nor am I a professional coder by any stretch of the imagination, as you might see), so the results are outputted in a somewhat basic format. Hopefully, the outputted data is useful for you though.
You’ll need to create a service account in the Google Cloud Platform to get going with this. There might look to be a lot of steps, but it shouldn’t take more than ten minutes to get going.
How to use the sheet
- Open this Google Sheet. Make a copy of the sheet (File > Make Copy). Or, you can go straight to this URL to make a copy – the choice is yours.
- Head to https://console.cloud.google.com/. If this is the first time you have used the Google Cloud Platform, you will probably be greeted with a T&C’s popup.
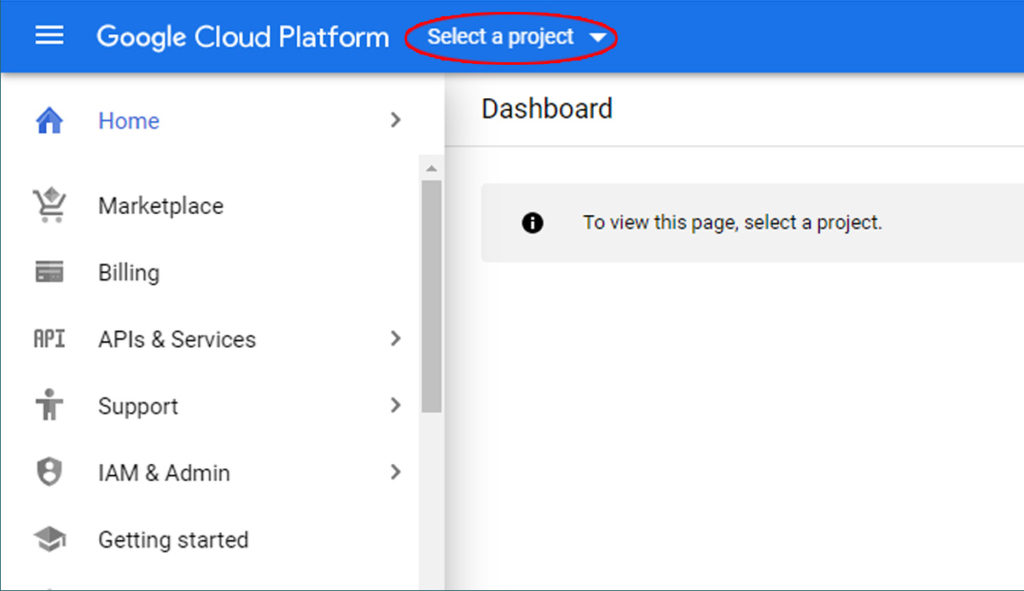
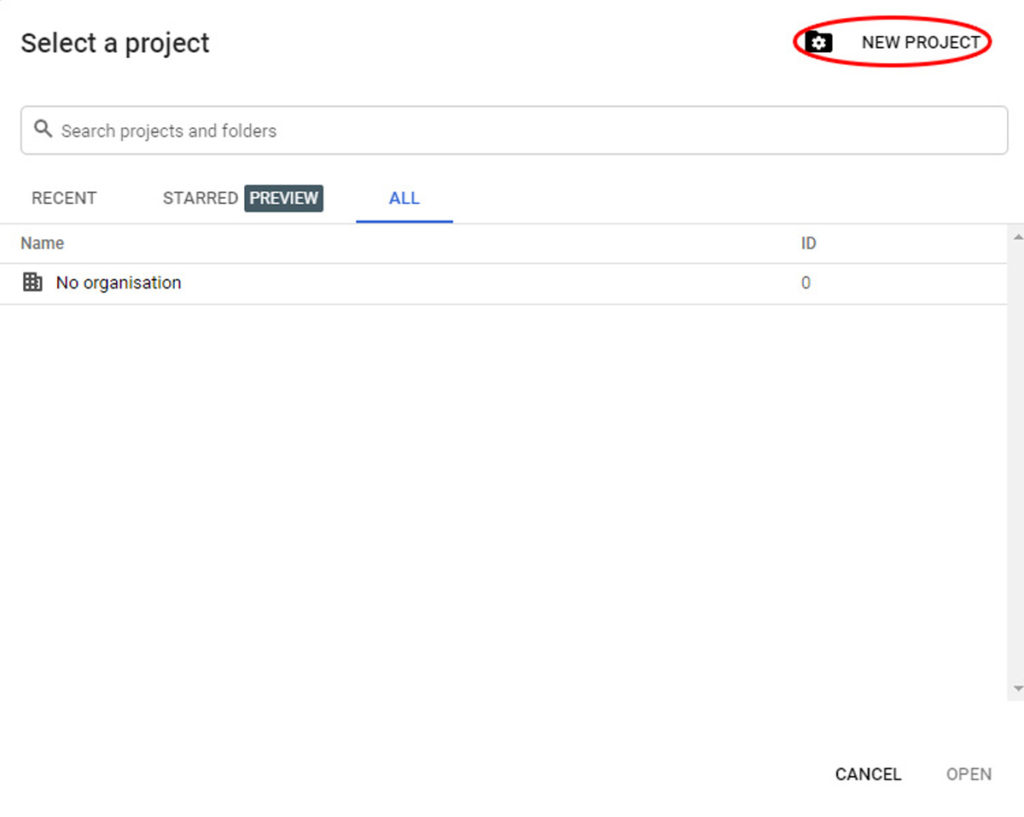
- Now, it is time to create a project. Head to the drop down menu in the header. If this is the first time you have used the Google Cloud Platform, it will probably say “Select a project”. If you already have projects in there, it might say an existing project’s name. Either way, click the menu, and you’ll be greeted with a popup. Click the “New Project” link in the top right corner.
- Next, you’ll need a Project Name. This can be anything. Click the blue ‘Create’ button.
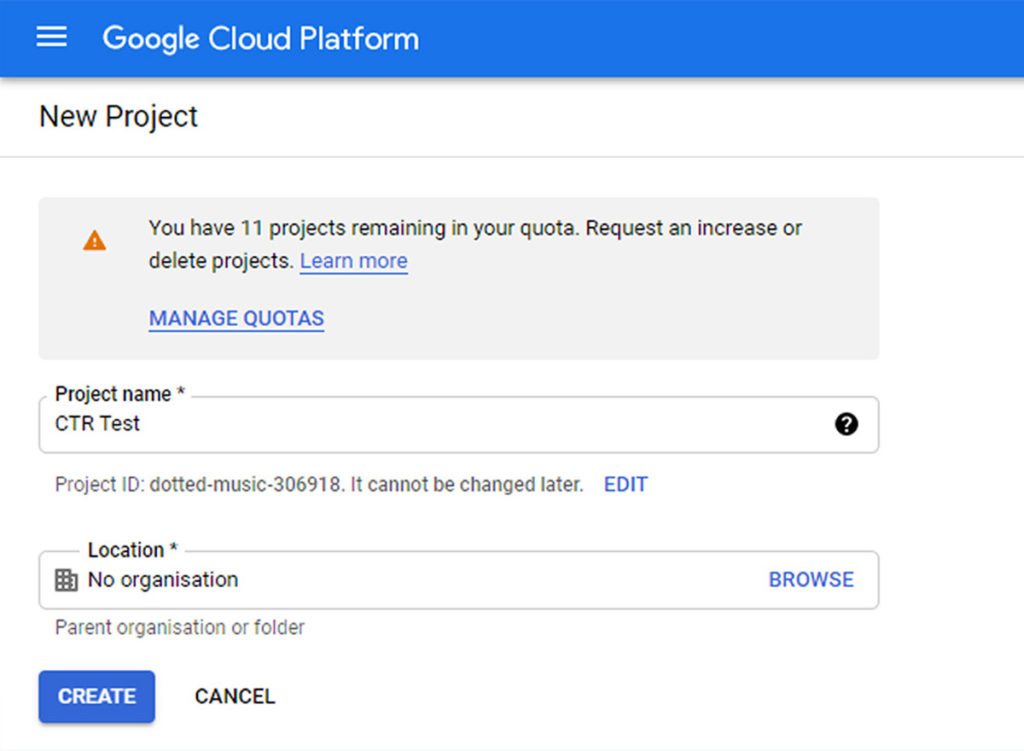
- After completing this form, you’ll be taken to a project home screen. Make sure that your recently created project is selected. From my experience, this can sometimes show the project that you have just created, but it can frustratingly also be another unrelated project. As such, before you move onto the next stage, make sure the correct project is selected in the top menu (in my case, this is the recently created “CTR Test” project):
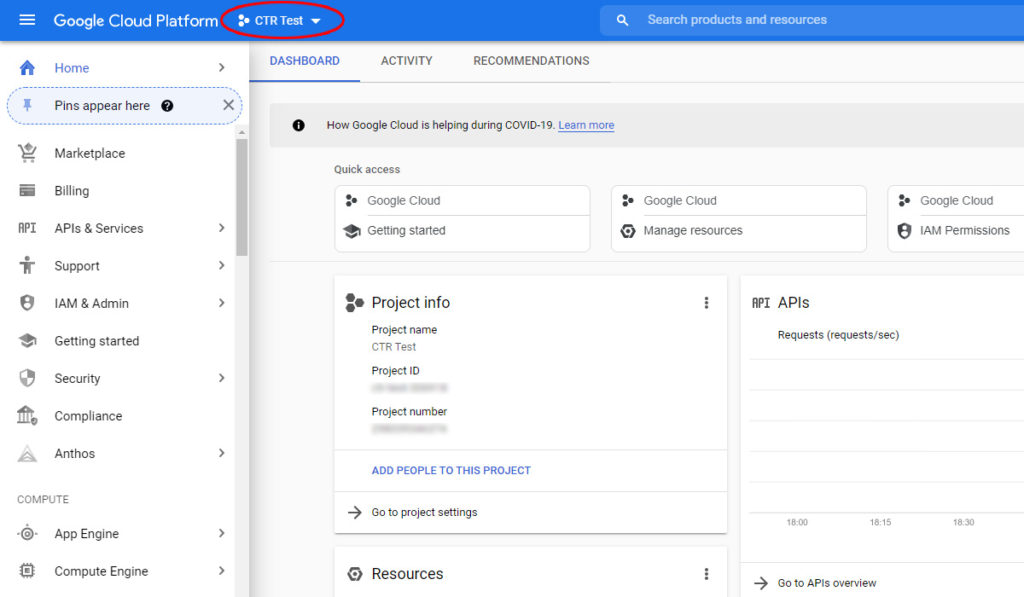
- Click the burger menu in the top left of the screen (it’s already open in the above screenshot). Navigate to APIs & Services > Credentials. Then, when you get to the Credentials screen, Create Credentials > Service account.
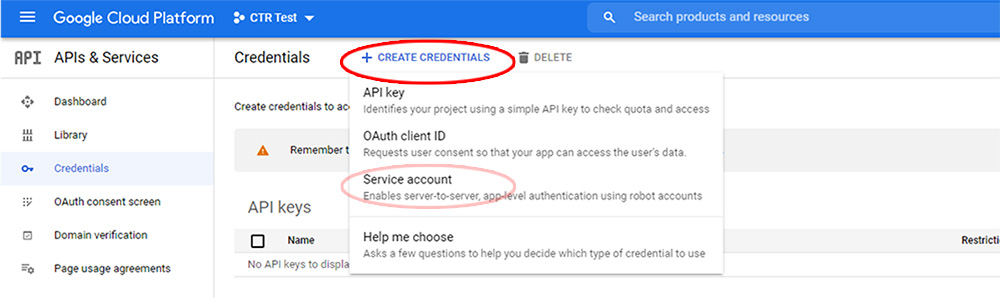
- You’ll now need to create your service account. Start by adding a Service account name (this can be anything). You can leave the Service account ID to autofill, and the description can be left blank. Click the white “Create” button.
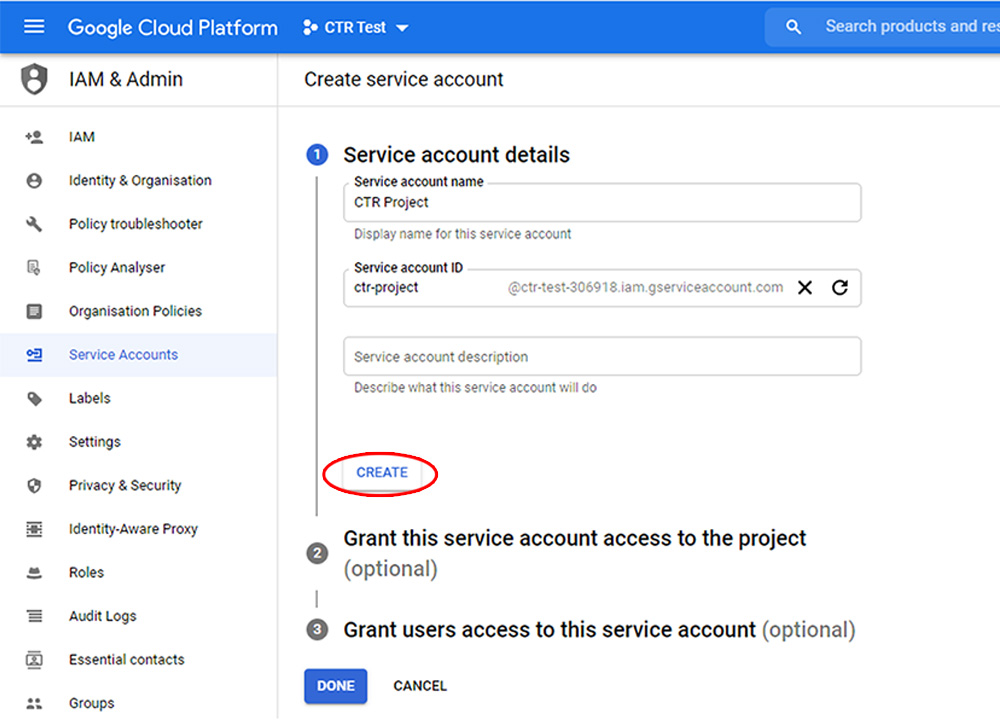
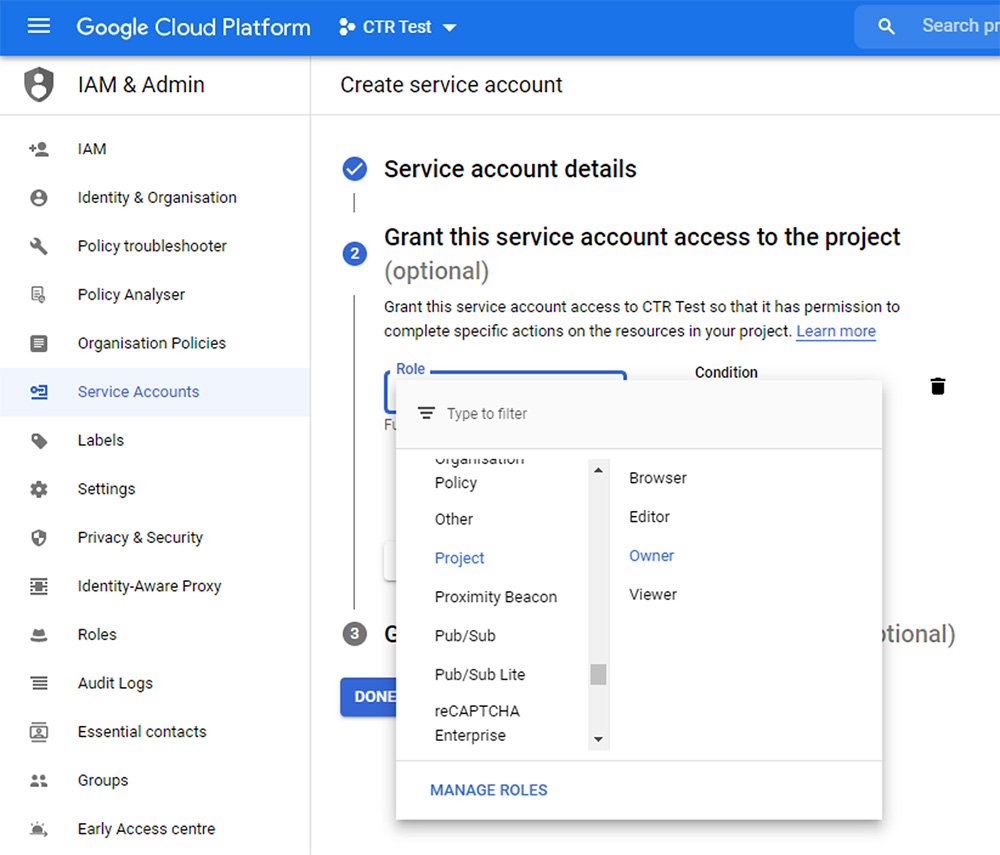
- You’ll now go to the next step. From the drop down menu, navigate to ‘Project’. Then, on the secondary menu that appears, click ‘Owner’. Click the white ‘Continue’ button.
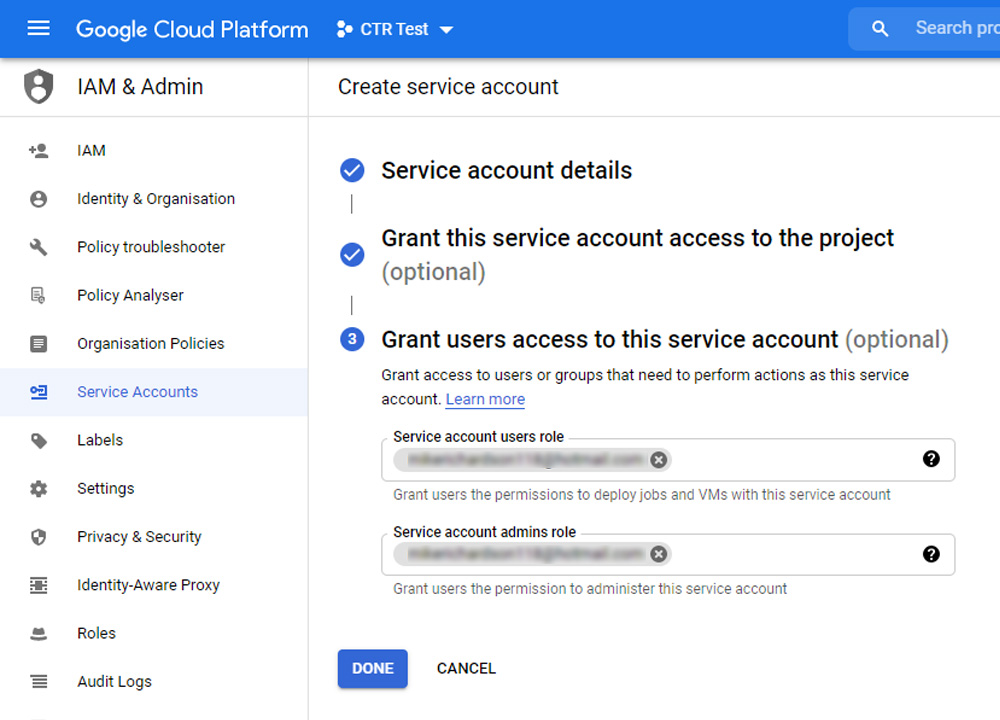
- The third step is simply adding your Google account email for both the “Service account users role” and “Service account admins role”. Once you’ve added this, click “Done”.
- You should now be in the account screen. Click into the Service account you have just created (it will be listed under “Service Accounts” and be in the format of an address ending in “iam.gserviceaccount.com”.
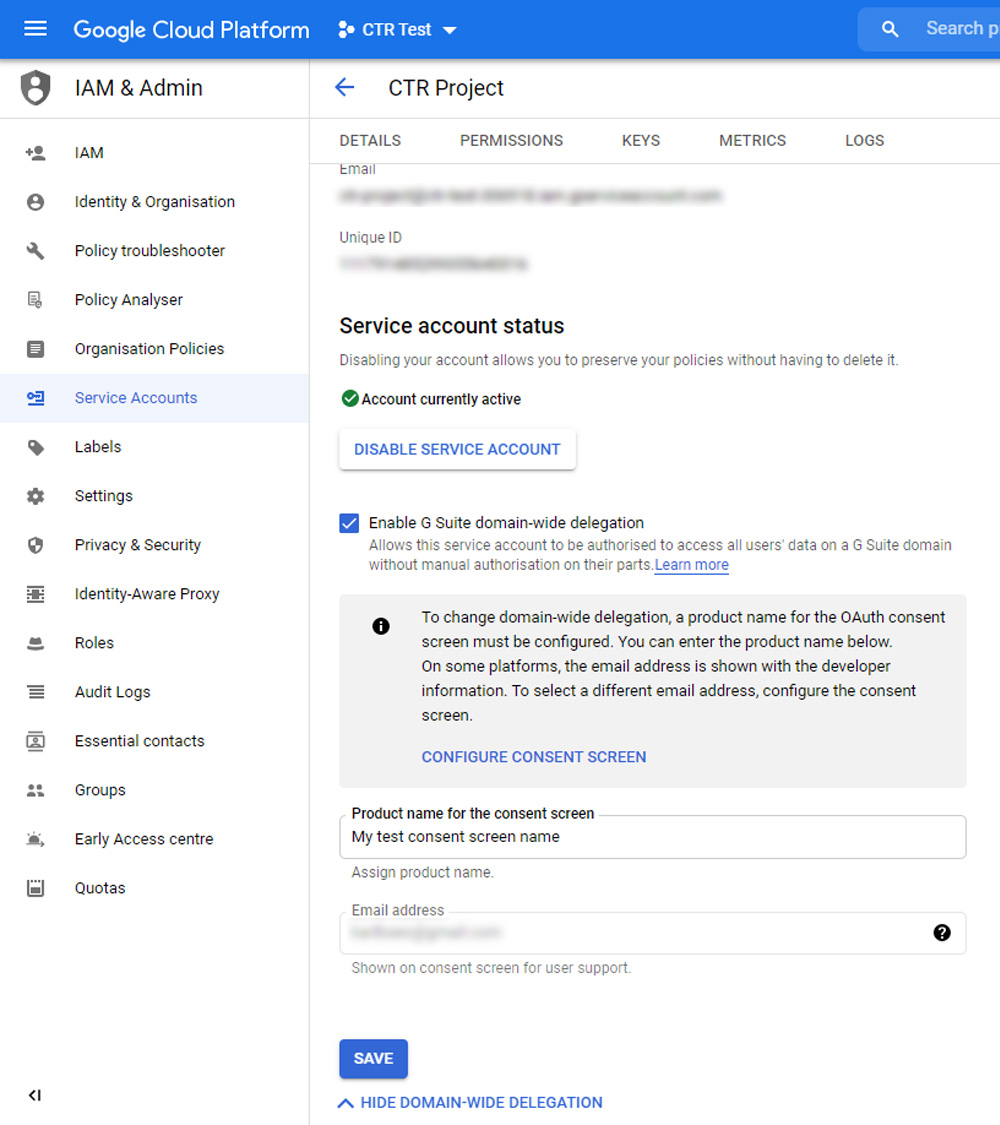
- On the service account screen, click ‘Show Domain-Wide Delegation’.
You will then need to tick the “Enable G Suite domain-wide delegation” checkbox.
Enter a “Product name for the consent screen” (again, it doesn’t really matter what this is). Then, click the blue “Save button.
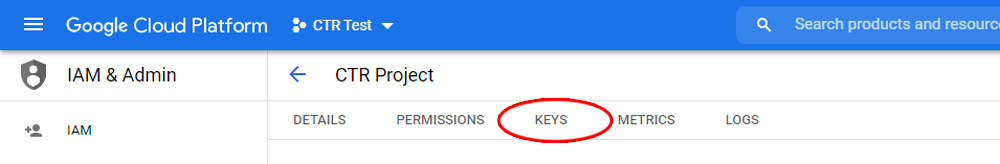
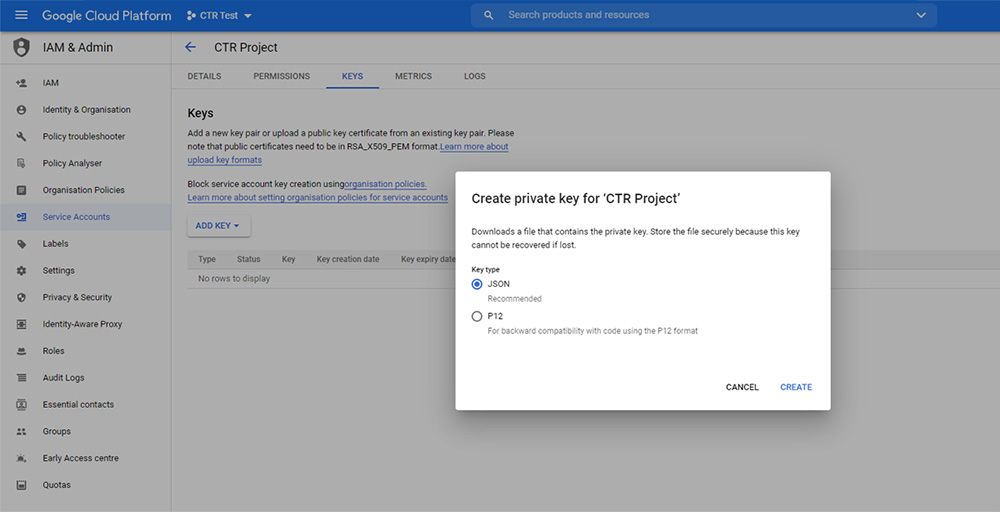
- On the same page, click the ‘Keys’ tab along the top. Then, navigate to Add Key > Create new key > JSON > Create. A file will start downloading to your computer.
- Open the downloaded file. You need to extract the client_email, client_id and private_key from it and put them to one side.
Remember to extract everything between the double quotes. Some guidelines:
client_email: This will be in the format of an email address
client_id: This is a 21-digit number.
private_key: This is very long, it starts with —–BEGIN PRIVATE KEY—– and ends with —–END PRIVATE KEY—–\n. Copy it all. - Armed with the above credentials, you now need to add these to the Google Sheet. It’s best to double click into each cell that you wish to add data to, so everything is pasted unformatted.
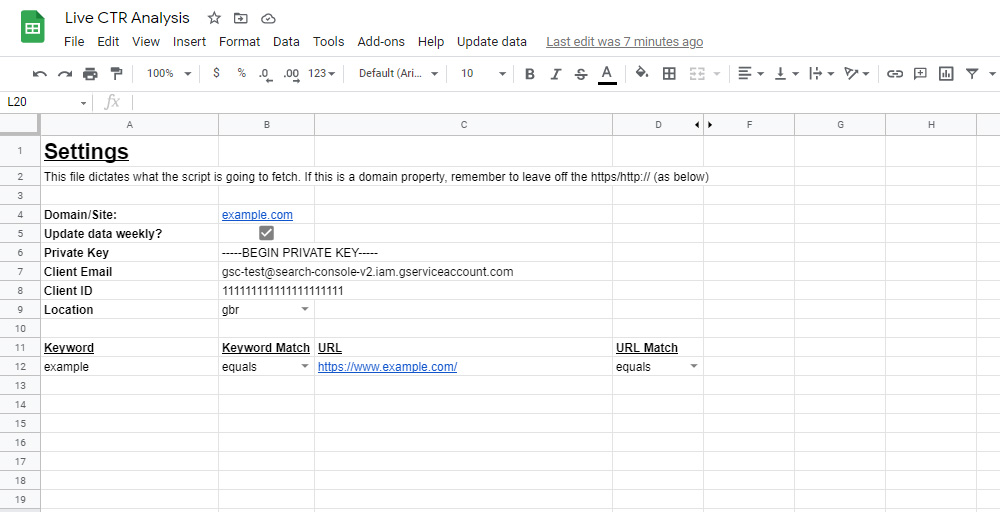
Go to the Settings tab and configure as follows:
Domain/Site: If your website is domain verified in Google Search Console, enter as example.com. If not, add the full URL such as https://www.example.com
Update data weekly: If this is ticked, the sheet will update with fresh data every Monday morning.
Private key: This is the long private_key you extracted from the previous step. Paste it exactly how it was formed in the file.
Client Email: This is the client_email field from the previous step.
Client ID: This is the client_id field from the previous step.
Location: This is where you want the Search Console data to pull its results from. Do you want it just to look at visits from the UK (gbr), the US (usa), Australia (aus) or Ireland (irl)? If you run a website out of these areas, you can adapt as necessary.
You can also complete the Keywords section, including the keywords, the match type, the URL, and the URL match type. An important point is in relation to the URL, make sure this is a full URL (with a trailing slash). You can add as many keywords as you like, keeping the same format as the template.
- Return back to Google Cloud Console. Search for “Google Search Console API” in the top search bar and click into it. Click the blue “Enable” button.
- That’s everything from Google Cloud Console for now. You now need to head into Google Search Console and head over to your desired property. Navigate to Settings > Users and permissions > Add User. Paste the “client_email” you extracted from a couple of steps ago and click “Add”.
- You’re all set. In the Google Sheet, head to the top nav and navigate to Update data > Manually refresh data. As this is the first time you are using the script, there will be some security/permission prompts. Navigate through all of these.
After going through all of the security popups, everything will be set up. Click Update data > Manually refresh data, and your Google Sheet should start to populate with all of the keyword data over the past sixteen months. For each keyword in your Settings list, a new tab will be created with the raw data.
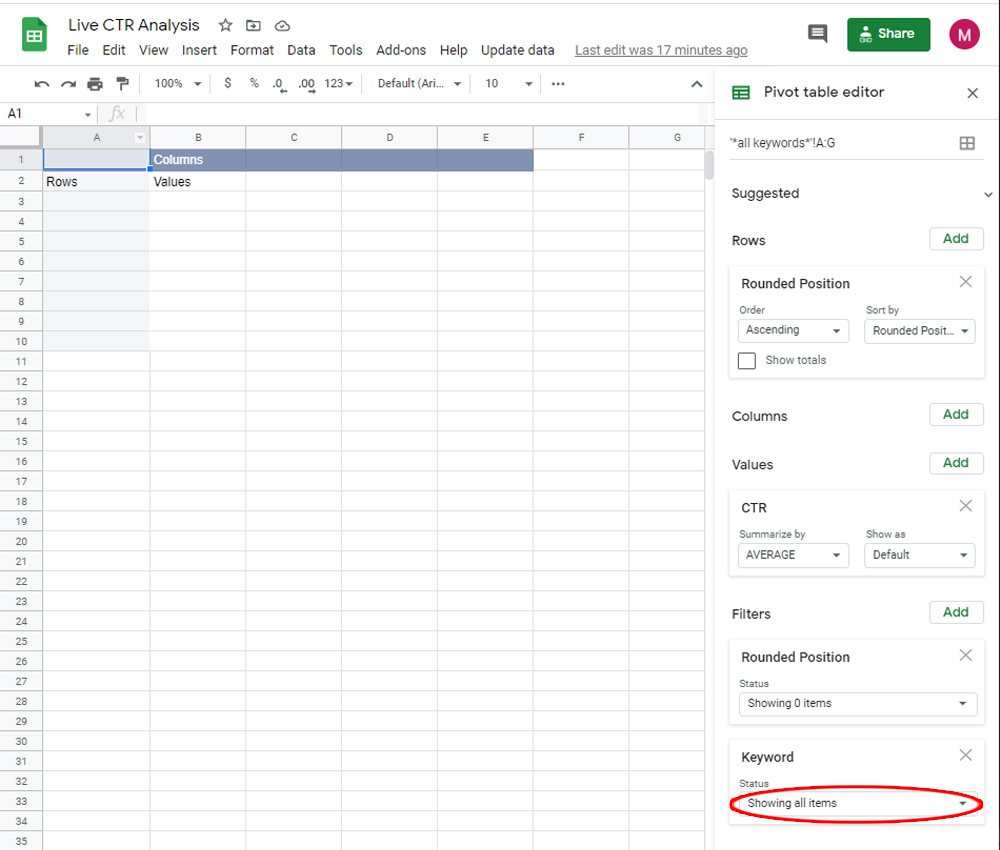
It’s important to note that if you have several keywords, there is a high chance that the script will timeout (a red error message will show at the top of the screen). This happens because there is a six-minute timeout limit within the Apps Script environment. If you click the “Manually refresh data” link again in the navigation, it will simply pick up where it left off and keep populating. This should only be an issue when you initially run the script, as it has to fetch through so many months of data. When it is run on a weekly basis, it’s only going through seven days’ worth, so takes far less time (unless you have selected a lot of keywords to track). - When the script has finished, you can head over to the Results tab. This contains a pivot table of the results. You’ll need to filter the Pivot table to select the keywords you have chosen. When you first run the script no keywords will be selected, so click into the ‘Keywords’ filter and check all that you want to look at.
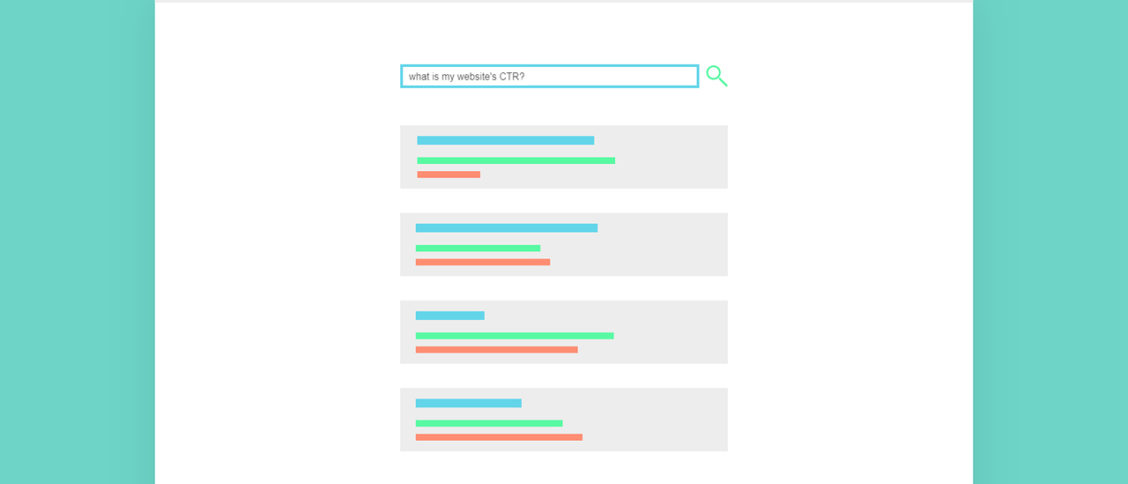
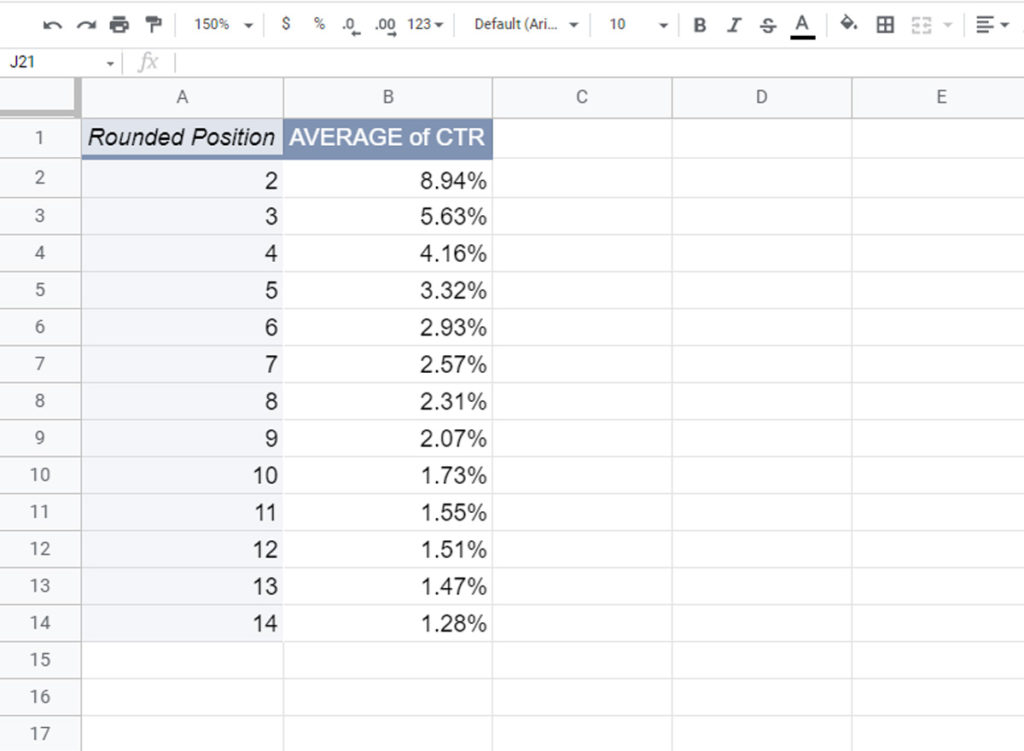
- That’s pretty much everything! You can add more filters (such as date ranges etc), through the simple Pivot table interface. After playing around, you’ll be left with a breakdown of positions resembling something like the following:
Why don’t I appear in #1 for anything?
Some of you may look at the data and wonder why you don’t see any #1 rankings.
This is due to the way in which Google calculates position data. There’s a full blog post explaining the process here, but in short, it uses search features to calculate positions.
Ultimately, if there is an AMP carousel or another search feature appearing, this will claim the #1 position for the purposes of Search Console data.
Sure, some SERPs won’t show any search features, or they might appear below the so-called standard organic listings. In these cases, you might appear in #1.
Troubleshooting
There are a lot of steps to the above (unfortunately, this is a side effect of using the latest data with a service account), and as such, things can go wrong.
If you’re getting a red permissions error, there’s a chance that you haven’t added your client_email to your Google Search Console account. This has been a common issue amongst those who have tested the sheet so far.
Another problem that some people have experienced is all of the tabs being created at the bottom of the sheet, but without any data. The common fix is making sure that you are using the correct URL format in the Settings sheet (remember those trailing slashes in the keyword list).
I’m happy to have a look at any sheets that anybody has trouble with, just drop me an email. However hopefully, this will provide most of you with some interesting, actionable data.